Mistake 4: Including irrelevant features
When training a model, it is recommended to avoid using irrelevant features. Adding such features can degrade the model’s performance in terms of time, interpretabilty, and performance. Irrelevant features are the ones that do not provide any information, introduce noise, increase overfitting, and so on. Examples of such features include:
- Row numbers. Sometimes, datasets come with a column specifying row numbers. These numbers do not add information and will likely cause overfitting if included in the model.
- Unique identifiers. Similar to row numbers, unique identifiers like usernames, e-mail addresses, ids, etc. are specific to each row and thus, will degrade the model’s performance.
- Timestamps. If rows are assumed to be independent, then, including timestamp information can cause severe overfitting.
- Constant values. This happens when the majority (or all) of the instances have the same value for a given feature. For example, a column having all zeros. In other words, there is low variance in the values.
- Features with many missing values. Having many missing values will not add significant information to the model.
- Non related information. Some features may include unrelated information to the problem at hand. For example, if trying to predict hand gestures from videos, hair color will not provide any useful information.
- Highly correlated variables. Variables with high correlation may be redundant and can add computational costs.
Of course, there are exceptions. For instance, timestamps are important when modeling timeseries data, thus, careful consideration should be made before discarding features depending on the problem.
As an example, we will use the WISDM dataset (Kwapisz, Weiss, and Moore 2010). The dataset has \(43\) features extracted from a cellphone accelerometer while several participants performed physical activities. Suppose that you want to predict the type of activity based on the acceleromter’s features. The following code reads the data. Missing values are denoted with the ‘?’ symbol. Thus, the na_values = "?" parameter is set to let know pandas that question marks should be marked as missing values (line \(3\)). Apart from that, the columns YAVG and ZAVG have erroneous values that look like “?0.01”. Those values will be set as missing values as well (lines \(6\) and \(7\)). Figure 4.1 shows the first rows and columns of the data frame.
import pandas as pd
df = pd.read_csv("data/wisdm/WISDM_ar_v1.1_transformed.csv",
                 na_values = "?")

# Mark values including a '?' such as '?0.01' as NaN.
df['YAVG'] = pd.to_numeric(df['YAVG'], errors='coerce')
df['ZAVG'] = pd.to_numeric(df['ZAVG'], errors='coerce')
df.head()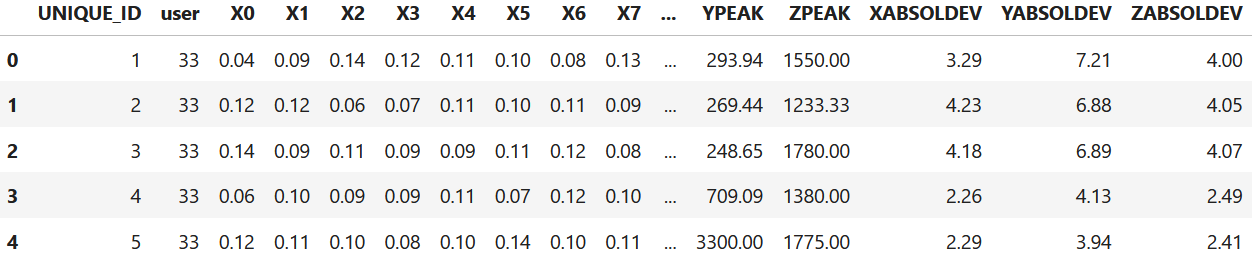
Figure 4.1: WISDM dataset.
The first thing to note is the UNIQUE_ID and user columns. The UNIQUE_ID indicates the row number and useris the user id. This information is irrelevant for the problem so the columns can be discarded.
An EDA analysis (see Mistake ??) can also be used to spot irrelevant variables. The report using the ydata-profiling package generates some alerts (see Figure 4.2).
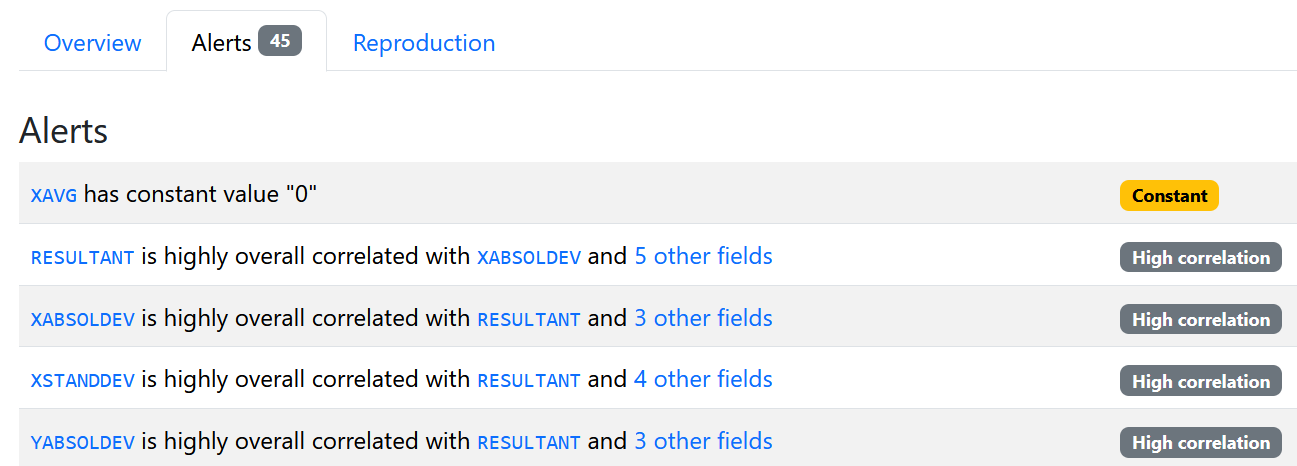
Figure 4.2: WISDM alerts.
The first alert shows that the XAVG column has a constant value of \(0\). The next alerts are about highly correlated variables. scikit-learn provides a way for identifying variables with low variance. The next code stores the features in variable X and uses a VarianceThreshold object to identify such variables. The user can specify a threshold (\(0.0\) in this example).
# Find features with low variance.
from sklearn.feature_selection import VarianceThreshold
X = df.drop('class', axis=1)
feature_names = X.columns
selector = VarianceThreshold(threshold = 0.0)
X = selector.fit_transform(X)

# Print names of removed features
mask = selector.get_support()
removed_features = feature_names[~mask]
print("Removed features:", list(removed_features))In this case, the XAVG variable was identified as having zero variance and deleted.