Introduction
Building error-free machine-learning-based systems is crucial, specially, nowadays that these systems are everywhere. From room-size servers stacked into huge buildings, to coin-size deep learning accelerators, these devices run machine learning algorithms that support daily critical operations in finance, logistics, aerospace, health, autonomous trucks/vehicles, and so on. Thus, it is our task to make sure those systems are robust, reliable, and trustworthy.
During the process of building a machine learning model, there are many points in which errors can make their way in –from data data collection, to deployment. The environment (and thus the data) is continuously changing. As such, one needs to be vigilant and keep monitoring the system to protect it against potential errors.
This book showcases the most common mistakes when building machine learning models during different phases. Each chapter focuses on a single mistake. For the sake of keeping the examples simple and focusing on the mistake at hand, some may incur in other mistakes. Every chapter demonstrates the corresponding mistake with code snippets and ways to avoid/correct the error. Library import statements and minor details may be omitted to keep the code simple however, the full source code of the examples is available.
Before delving into the mistakes, the following subsection introduces the terminology that will be used. So, I recommend you to take a look and familiarize yourself with the terms. With the help of the Science-Fish-Team, let’s begin our journey against the neuruptors!!!
Terminology
In this section, I will introduce the terminology that we will use for the rest of the book.
Most of the time, datasets are stored as tables or in Python terminology, pandas data frames or numpy arrays. Figure 0.2 shows the classic IRIS dataset (Fisher 1936) stored in a pandas data frame.
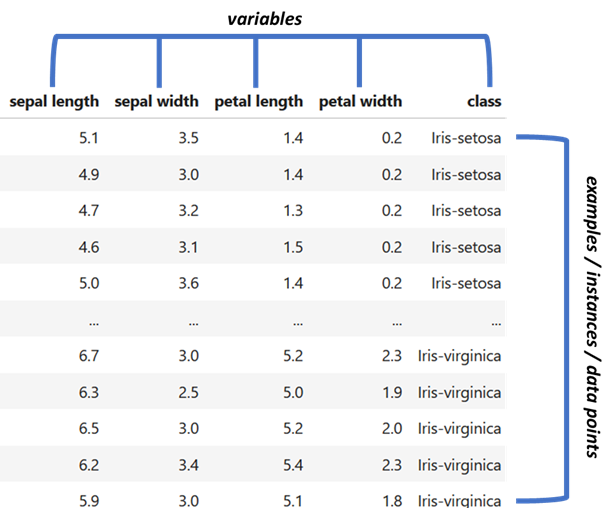
Figure 0.2: First rows of the IRIS dataset.
The columns represent variables (features) and the rows represent examples also known as instances or data points. In this table, there are \(5\) variables sepal length, sepal width, petal length, petal width and the class. Each row represents a specific plant. In machine learning terminology, rows are more commonly called instances whereas in statistics they are often called data points or observations. Here, I will use those terms interchangeably.
Figure 0.3 shows the same data frame. Suppose that we are interested in predicting the class based on the other variables. In machine learning terminology, the variable of interest (the one that depends on the others) is called the class or label for classification problems. For regression, it is often referred to as y. In statistics, it is more commonly known as the response, dependent, or y variable, for both, classification and regression.
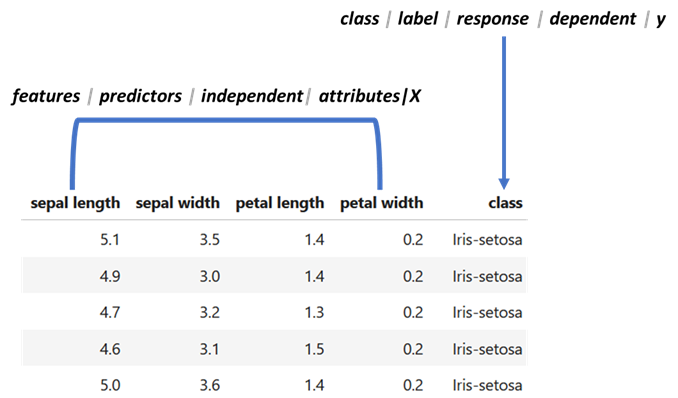
Figure 0.3: First rows of theIRIS dataset. The first four columns are the features and the last column is the class.
In machine learning terminology, the variables used to predict the class are called features or attributes. In statistics, they are typically referred as predictors, independent variables, or X. The term feature vector is used often in machine learning. A feature vector is an array containing the features of a given instance. For example, the feature vector of the first instance in Figure 0.3 is \([5.1,3.5,1.4,0.2]\).
Regarding algorithms, the term model will be used to refer to classifiers or regression models. From the context, it should be clear which one it refers to, or if both.
Now that we are armed with this terminology, let’s begin fighting those neuruptors!!!